Collecting, storing, and presenting Unifi metrics with the TIG stack (part 2)
Welcome to Part 2 of this article. I hope in the first part you understood a bit more about how we will organize our collected data into separate databases, how we can create simple databases, and lastly how we can set our retention policies as desired. In this part, we’re going to dig in a bit further into actually collecting some data from our Unifi devices. Let’s get started with the first piece which will be to enable SNMP collection.
If you’re a more advanced user, then skip down to the TL;DR tag where I’ll simply outline the basics with commands and output samples.
Enable SNMP Collection
The first thing you’re going to need to do is ensure you have SNMP enabled on your Unifi SDN Controller or manually enabled on the device individually. I won’t cover individual devices, you’ll need to do some googling as I can’t cover all the possible devices. I’ll provide the basics here for the controller.
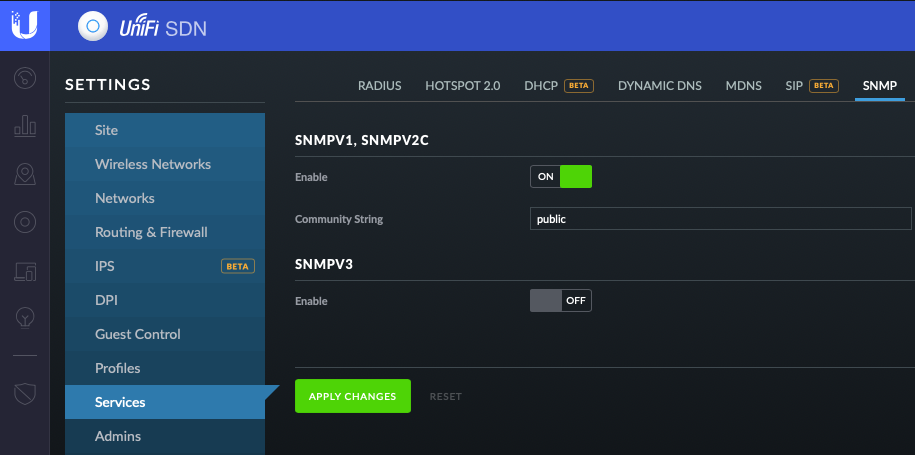
- First you’ll login to the controller, and navigate to settings
- Next you’ll click onto the SNMP tab at the top of the screen
- Last you’ll make sure to enable v1/v2/v3 and set your community string (keep in mind you’ll need to specify this community string later)
Creating the Configuration file
First we need to create the Telegraf.conf file to be used. This file will be where we configure exactly WHAT we want to collect from WHICH devices. If we attempt to launch the container without this file, it will fail to do much useful for us. There are 2 options for grabbing a default configuration. One option is to simply download it from the Telegraf GitHub Repo. You can then copy/paste into the file, wget, curl, etc. Alternatively, you can use docker to spin up a container that will simply output the default configuration to a file locally. In the command below we are telling docker to run a new container with the remove flag to delete it after it exits, and calling the telegraf config command to output the running configuration (aka the default).
docker run --rm telegraf telegraf config > telegraf.confSetting the Agent and Output Plugin
Now we have our base configuration. We need to customize this configuration to our needs. Let’s start with a few of the basics. One thing to keep in mind as we navigate the configuration, is to keep spacing and formatting consistent.
The first piece we’ll quickly customize is our [agent] section of the config. This simply controls how often we’ll be sending the metric and the hostname or “host” tag being used. These are simply defaults if not set more specifically in later sections. Simply find the main [agent] section, and adjust the subsections seen appropriately.
[agent]
  interval = "15"
  hostname = "Your Hostname Here"
Next we need to adjust our Output Plugins. This is where we tell Telegraf where to send it’s metrics when collected. In this case, we’ll be using the InfluxDB we setup in Part 1: Storing. Personally, I like leaving the default configuration entries intact, and creating new sections so I have a reference. This means leaving the lines with the # at the start, and simply adding new lines below, or creating my own sections. I’ll share what mine looks like here:
[[outputs.influxdb]]
  ## The full HTTP or UDP URL for your InfluxDB instance.
  ##
  ## Multiple URLs can be specified for a single cluster, only ONE of the
  ## urls will be written to each interval.
  urls = ["http://localhost:8086"]

  ## The target database for metrics; will be created as needed.
  database = "telegraf_unifi"
  tagexclude = [ "influx_database" ]
  [outputs.influxdb.tagpass]
    influx_database = [ "telegraf_unifi" ]</code></pre>
So you’ll notice if you searched for the [outputs.influxdb] you would have seen a bunch of commented out lines. I’ve simply copied the few to go with the URL configuration parameter. Everything above should be able to be set just as seen. No need for substitution to fit your instance, unless you are doing something non-standard - in which case I would hope you get what needs adjusting. The important things to mention now, is that we’ve set the URL of our InfluxDB along with the port that it’s listening on. Next we’ve configured the database that we are going to write to. If you read Part 1 you’ll remember this is the name of the DB we created. You’ll also recall I mentioned being able to place our metrics into separate DB for organization and scale. The way we do this is using the tagexclude and the tagpass parameters.
We’ll dig in a bit more when we set the tag below. The tagpassoption is simply saying that ONLY metrics with this tag should be written to this output plugin entry. This allows us to create a filter for this InfluxDB configuration. Imagine if you wanted to collect metrics from say 3 other types of sources (a UPS system, your Docker host, a server, etc). We can use this filtering, to make sure that ONLY those metrics for which we want recorded to each DB is written. This is very powerful for keeping things tidy and scalable.
The tagexclude is simply saying that when we record a metric to this DB, we DO NOT want the tag specified with this parameter, to be written with the metric. This lends us the ability to keep our data sets clean. While using that tag as a filter is an efficient way to direct certain metrics to certain DB’s, it can create a mess of extra series data we don’t need. This helps us simply keep things clean and organized as expected.
Setting the SNMP configuration
So now we get to the most complicated and intricate section. The mechanism by which we’ll be collecting out metrics, is SNMP. I’d suggest hitting up The Google if you’re not familiar. At a high level, you will need to supply what is known as a MIB to Telegraf so it knows how to navigate and break down what it will read from our Unifi hardware. These MIB’s translate an OID (object identifier) into a known metric. So it will take something like 1.3.6.1.2.1.1.1 and turns it into sysDescr as a Read Only string. If this doesn’t make sense or seems foreign, revert to my earlier comment about Google. Mapping these MIB’s will happen when we launch the container, so be sure to grab those in that section. These are required for a handful of the metrics grabbed below.
Due to the sheer line count of items, I’ll reference my GitLab repo as the place to grab the full section details. Specifically you’ll be looking for the following three files:
In each of these entries, you’ll see a set of common fields at the beginning. Let’s walk through what these are and make sure you configure them appropriately.
[[inputs.snmp]]
  # List of agents to poll
  agents = [ "hostname-or-IP" ]
  # Polling interval
  interval = "60s"
  # SNMP version, UAP only supports v1
  version = 2
  # SNMP community string.
  community = "public"
  # Measurement name
  name = "snmp.USG"

--------------------------

  [inputs.snmp.tags]
    influx_database = "telegraf_unifi"</code></pre>
So just as we saw with the outputs, you can create multiple inputs of the same type. In this case [[inputs.snmp]] can be created multiple times in a single file. agents will obviously need you to enter the hostname or IP of your Unifi device. interval is where we decide to override the default polling set above, so here we’re only polling every 60 seconds vs every 15 seconds. In reality, you can even bump this up higher unless you would like the granularity. Keep in mind, the more granular with the amount of objects we’re collecting, means we will be storing a LOT of data. Keep this in mind that data grows in size and you need storage to support. The SNMP settings should match what you configured above in your Unifi controller or device interface. The measurement name can be set as you please, but I like the format used here of collection.Device.
You’ll see at the end of each section the [inputs.snmp.tags] option with the specification of a tag below influx_database. Now if you recall when we created the output plugin specification to record this metric to our InfluxDB, we created a filter based on the tag. So now we’ve added this tag to all our metrics on this input configuration. Now we know our metrics should only be recorded to the inputs with a tagpassentry matching this tag.
All that is left now is to choose which metrics you would like to grab. I have narrowed down the list to what I believe to be potentially useful for displaying into Grafana or for querying if I would like to be alerted for conditions that cause for alarm. Most entries should have a description above them commented out. If you’d like to customize your entries, just comment out the items you don’t want to collect and/or simply remove the lines altogether.
An aside on tagpass, tagexclude, and tagdrop
A side note about this method. If we only setup outputs that use tagpass, this will effectively filter everything as expected. If we were to have an output that DOES NOT have the tagpass option, our data would in fact be recorded there as well. An example would be if we created a generic InfluxDB entry that had no filtering, our metrics would then be written to it as well. To ensure this does not happen, we can use the the .tagdrop option. The below example would ensure that another [outputs.influxdb]entry would NOT record our Unifi metrics as setup above. This option is sayin if we see influx_databaseas a tag on the metric, to drop it and do not send it to the output.
  [outputs.influxdb.tagdrop]
    influx_database = [ "*" ]
Launching Telegraf in Docker
Now that we have our configuration ready to go, it’s time to dig into creating our container. I’ll walk through the basics of using a simple docker container to setup my instance. If you use a local install instead or a VM, you’ll just need to drop our customized configuration file into place.
Login to your system of choice (your preferred docker host) and lets get the container setup. Now bear in mind, there are many different options that can be added to this container and setups to record other metrics, but those are out of scope for this article - so we’ll just focus on what’s required for Unifi. The full documentation for running this container can be found on the official Telegraf Docker Hub entry. You’ll simply use the command below, replacing $PWD with the directory containing your config file from above. Or if you’re launching from the directory where it resides, the command will work as is. Please note you will need to download the Unifi official MIB’s from the links below as well.
$ docker run -d --name=telegraf \
      -v $PWD/telegraf.conf:/etc/telegraf/telegraf.conf:ro \
      -v $PWD/UBNT-MIB:/etc/telegraf/UBNT-MIB \
      -v $PWD/UBNT-UniFi-MIB:/etc/telegraf/UBNT-UniFi-MIB \
      telegraf
Once you’ve launched your container, you can use the same commands from Part 1to ensure our container is running as expected. You should see a similar output to the below:
user@server:$ docker ps -a
CONTAINER ID        IMAGE                               COMMAND                  CREATED             STATUS                   PORTS                                                                                                                                                                     NAMES
89e00fc19f21        telegraf:alpine                     "/entrypoint.sh tele…"   21 hours ago        Up 21 hours                                                                                                                                                                                        telegraf
fff3edce24f8        influxdb:latest                     "/entrypoint.sh infl…"   6 weeks ago         Up 21 hours              0.0.0.0:8083->8083/tcp, 0.0.0.0:8086->8086/tcp                                                                                                                            influxdb
And now, if you’ve let the collection run for at least 1-2 intervals (per your config) - we can use the influx shell to see if we have data. To do this, we need to invoke the shell again inside the container:
user@server$ docker exec -it influxdb influx
Connected to http://localhost:8086 version 1.6.1
InfluxDB shell version: 1.6.1
>
Now we run a simple command to see if we have series data being generated. If successful, you should see something similar to what I have displayed below.
> show series on telegraf_unifi
key
---
icmpMsgStatsTable,agent_host=orion,host=unRAID,index=1.0
icmpMsgStatsTable,agent_host=orion,host=unRAID,index=1.11
icmpMsgStatsTable,agent_host=orion,host=unRAID,index=1.3
icmpMsgStatsTable,agent_host=orion,host=unRAID,index=1.8
icmpMsgStatsTable,agent_host=orion,host=unRAID,index=2.131
icmpMsgStatsTable,agent_host=orion,host=unRAID,index=2.132
icmpMsgStatsTable,agent_host=orion,host=unRAID,index=2.133
icmpMsgStatsTable,agent_host=orion,host=unRAID,index=2.135
icmpMsgStatsTable,agent_host=orion,host=unRAID,index=2.136
icmpMsgStatsTable,agent_host=orion,host=unRAID,index=2.143
icmpStatsTable,agent_host=orion,host=unRAID,index=1
icmpStatsTable,agent_host=orion,host=unRAID,index=2
ifTable,agent_host=apollo,host=unRAID,ifIndex=1,ifName=0/1
ifTable,agent_host=apollo,host=unRAID,ifIndex=10,ifName=0/10
ifTable,agent_host=apollo,host=unRAID,ifIndex=11,ifName=0/11
ifTable,agent_host=apollo,host=unRAID,ifIndex=12,ifName=0/12
ifTable,agent_host=apollo,host=unRAID,ifIndex=13,ifName=0/13
ifTable,agent_host=apollo,host=unRAID,ifIndex=14,ifName=0/14
ifTable,agent_host=apollo,host=unRAID,ifIndex=15,ifName=0/15
ifTable,agent_host=apollo,host=unRAID,ifIndex=16,ifName=0/16
ifTable,agent_host=apollo,host=unRAID,ifIndex=17,ifName=0/17
ifTable,agent_host=apollo,host=unRAID,ifIndex=18,ifName=0/18
And that’s it! We’ve now successfully configured our DB, setup our collection via SNMP, and logged our Metrics from the Unifi hardware. We’re getting there. Now all that is left will be to setup Grafana to visualize all these awesome metrics. Stay tuned for Part 3!
TL;DR
- Set SNMP collection on Unifi Controller or Device
- Take not of your Version and Community String
- Create a default config to start with
- Set your Agent settings appropriately
- Configure your Output Plugin for InfluxDB database from part 1
- Be sure to use the
tagpassandtagexcludeoptions to filter unifi metrics and scrub the tag from the metric
- Be sure to use the
- Configure your SNMP inputs for the various Unifi device types (UAP, USG, USW)
- Take note of the specific settings at the head of each section
- Take note of the specific tags entry at the end of each section
- Pick you preferred or desired metrics to collect
- Spin up your telegraf container, mapping the config file and MIBs
- Enter influx shell and validate we have metrics (after 2-3 of your intervals have passed for collection)
docker run --rm telegraf telegraf config > telegraf.conf

[agent]
  interval = "15"
  hostname = "Your Hostname Here"

[[outputs.influxdb]]
  ## The full HTTP or UDP URL for your InfluxDB instance.
  ##
  ## Multiple URLs can be specified for a single cluster, only ONE of the
  ## urls will be written to each interval.
  urls = ["http://localhost:8086"]

  ## The target database for metrics; will be created as needed.
  database = "telegraf_unifi"
  tagexclude = [ "influx_database" ]
  [outputs.influxdb.tagpass]
    influx_database = [ "telegraf_unifi" ]

[[inputs.snmp]]
  # List of agents to poll
  agents = [ "hostname-or-IP" ]
  # Polling interval
  interval = "60s"
  # SNMP version, UAP only supports v1
  version = 2
  # SNMP community string.
  community = "public"
  # Measurement name
  name = "snmp.USG"

--------------------------

  [inputs.snmp.tags]
influx_database = "telegraf_unifi"- inputs.snmp-unifi-UAP
- inputs.snmp-unifi-USG
- http://dl.ubnt-ut.com/snmp/UBNT-MIB
- http://dl.ubnt-ut.com/snmp/UBNT-UniFi-MIB
$ docker run -d --name=telegraf \
      -v $PWD/telegraf.conf:/etc/telegraf/telegraf.conf:ro \
      -v $PWD/UBNT-MIB:/etc/telegraf/UBNT-MIB \
      -v $PWD/UBNT-UniFi-MIB:/etc/telegraf/UBNT-UniFi-MIB \
      telegraf

user@server:$ docker ps -a
CONTAINER ID        IMAGE                               COMMAND                  CREATED             STATUS                   PORTS                                                                                                                                                                     NAMES
89e00fc19f21        telegraf:alpine                     "/entrypoint.sh tele…"   21 hours ago        Up 21 hours                                                                                                                                                                                        telegraf
fff3edce24f8        influxdb:latest                     "/entrypoint.sh infl…"   6 weeks ago         Up 21 hours              0.0.0.0:8083->8083/tcp, 0.0.0.0:8086->8086/tcp                                                                                                                            influxdb

user@server$ docker exec -it influxdb influx
Connected to http://localhost:8086 version 1.6.1
InfluxDB shell version: 1.6.1
>

> show series on telegraf_unifi
key
---
icmpMsgStatsTable,agent\_host=orion,host=unRAID,index=1.0 icmpMsgStatsTable,agent\_host=orion,host=unRAID,index=1.11 icmpMsgStatsTable,agent\_host=orion,host=unRAID,index=1.3 icmpMsgStatsTable,agent\_host=orion,host=unRAID,index=1.8 icmpMsgStatsTable,agent\_host=orion,host=unRAID,index=2.131 icmpMsgStatsTable,agent\_host=orion,host=unRAID,index=2.132 icmpMsgStatsTable,agent\_host=orion,host=unRAID,index=2.133 icmpMsgStatsTable,agent\_host=orion,host=unRAID,index=2.135 icmpMsgStatsTable,agent\_host=orion,host=unRAID,index=2.136 icmpMsgStatsTable,agent\_host=orion,host=unRAID,index=2.143 icmpStatsTable,agent\_host=orion,host=unRAID,index=1 icmpStatsTable,agent\_host=orion,host=unRAID,index=2 ifTable,agent\_host=apollo,host=unRAID,ifIndex=1,ifName=0/1 ifTable,agent\_host=apollo,host=unRAID,ifIndex=10,ifName=0/10 ifTable,agent\_host=apollo,host=unRAID,ifIndex=11,ifName=0/11 ifTable,agent\_host=apollo,host=unRAID,ifIndex=12,ifName=0/12 ifTable,agent\_host=apollo,host=unRAID,ifIndex=13,ifName=0/13 ifTable,agent\_host=apollo,host=unRAID,ifIndex=14,ifName=0/14 ifTable,agent\_host=apollo,host=unRAID,ifIndex=15,ifName=0/15 ifTable,agent\_host=apollo,host=unRAID,ifIndex=16,ifName=0/16 ifTable,agent\_host=apollo,host=unRAID,ifIndex=17,ifName=0/17 ifTable,agent\_host=apollo,host=unRAID,ifIndex=18,ifName=0/18)